

While the majority of EVE players are content to run missions or smash spaceships together for fun and profit, for some it’s the complex markets and industrial gameplay that hold their interest. They fill the Market Discussion forum with speculation and pack the room during the economy talks at events like EVE Fanfest, and they’ve been asking CCP for more economic data since the QENs were cancelled. This week they got their wish as CCP Quant released the first of a new series of monthly economic updates packed full of graphs and statistics from all corners of the EVE universe.
In this edition of EVE Evolved, I look at the new monthly economic reports and glean some useful information from February’s stats. Where is the safest place to mine? What effect did Skill Trading have? And which nullsec alliances are moving their assets?
 The old QENs had some problems
The Quarterly Economic Newsletters were a fascinating source of statistics and insight into EVE‘s economy, but they often contained faulty assumptions on economic changes. Dr Eyjo knew his field well but frequently attributed market changes to economic events and trends rather than the more obvious effect of game mechanics and other things that don’t happen in the real world. The reports were a great way to promote EVE‘s unique capacity as an economic sandbox to the media, but the players in EVE‘s Market Discussion forum often provided better insight and analysis.
The QENs hold a special place in EVE‘s history for me as my first ever article for Massively-of-old was actually a rebuttal to a news post Dr Eyjo wrote accompanying the Q4 2007 QEN report. In the post, he mistakenly announced that removing the NPC supply of shuttles would cause Tritanium to break the artificial 3.6 ISK per unit cap. Many players were angry when they bought up Tritanium on Dr Eyjo’s advice only to find out that items other than shuttles also maintained the same tritanium price cap. Despite these occasional oversights, the reports were a fantastic look into changes in the EVE economy over time and the impact of new ships or expansions. They’ve caused more than a few players to become interested in economics and even go on to study it.
 New economic reports (yay graphs!)
The QENs were supposed to come back in a new annual format further down the line, but that never materialised and Dr Eyjo eventually left CCP in 2014. Rather than trying to replicate the professional style of the old QENs, the new reports simply provide regular snapshots of the EVE economy without any written analysis or speculation on what may have caused particular changes or trends.
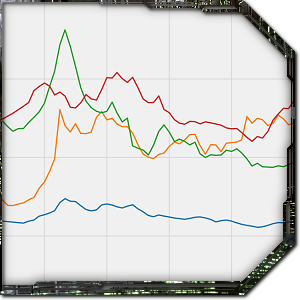
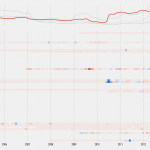
At the end of each month, CCP Quant runs a series of carefully crafted SQL queries on the main EVE database to extract a ton of economic information from across the game. He then compiles it into graphs (because we EVE players seriously love our graphs) and releases them alongside a full CSV exports of the data so that players can perform their own analyses. As the new economic reports are released on a monthly basis and we’ll be getting the same types of data each time, we can more easily compare data from month to month and find interesting trends. The written analysis and speculation is now entirely up to players. February’s graphs and charts are included below for your convenience:

 Where does all the ISK come from?
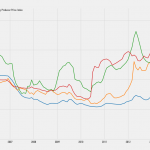
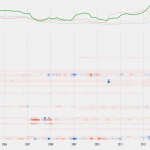
Taking a flip through the graphs provided this month, I’m most interested in the list of ISK sinks and ISK faucets. The top three generators of new ISK in the EVE economy for February were predictably NPC bounties (33.876 trillion ISK), sales of commodities to NPC corporations (18.172 trillion ISK), and Incursion payouts (11.245 trillion ISK). The commodities sales include sleeper AI loot and valuable tags from NPC loot, so all of these top three are the direct result of players farming NPCs. Agent mission rewards also accounted for about another 2.4 trillion ISK.
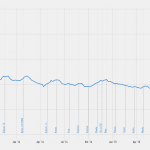
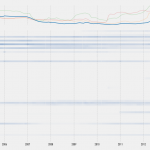
The main way ISK is removed from the game this month was the purchase of skills from NPC corps on the market, with 13.602 trillion ISK sunk into skill books over the period. This would normally hint that EVE still has a large number of newer players and those who are still actively training toward new areas of gameplay, but there’s a simpler reason this was so high in February. The introduction of Skill Injectors meant players could buy new skills and train them instantly, so it’s understandable that there would be a spike in skill purchases. The ISK Velocity chart also shows a huge spike in Februrary due entirely to players trading in skill injectors. At the end of February 2016, the total liquid ISK in the EVE Online economy was 948.043 trillion ISK (equivalent to $16.45 million using PLEX conversion).
 Trade hubs and the safest place to mine
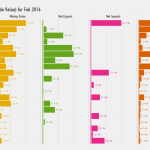
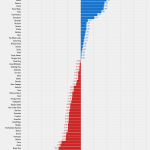
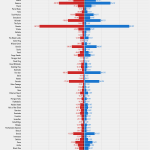
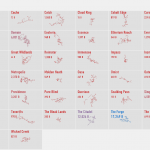
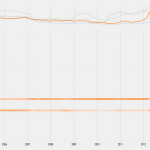
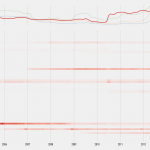
Another useful graph in the report was the Regional Data for February 2016 chart, which shows the net value of various types of economic activity depending on region. The Forge contains more trade than all other regions put together with 707.5 trillion ISK in transactions, which was expected as this region contains the game’s central trade hub in Jita. The Forge is also the region with the highest production and import levels, which isn’t surprising as everyone ships their stuff to Jita for sale and people try to build as close to the system as possible in order to shorten hauling trips and source cheap materials nearby.
Domain comes second in raw trade volume at 114.1 trillion ISK thanks to the major trade hub in the Amarr system, with Sinq Liason and Heimatar coming in third and fourth place. It’s interesting to see that EVE‘s trade is still incredibly centralised, and that Dodixie in Sinq Liason has grown in market share in recent years. It’s also interesting to see that there’s a lot of mining going on in The Forge and that high mining value also seems to be correlated with high ship destruction value. The safest popular mining location would seem to be Everyshore, which pumped out 800 billion ISK in ore during February and has an active market but has only 100 billion ISK of ship destruction. This could also indicate the presence of a huge mining operation here, possibly one using bots.
 What are nullsec alliances getting up to?

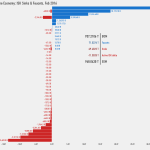
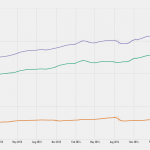
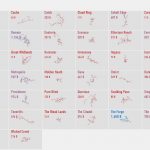
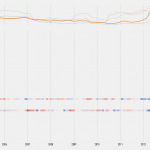
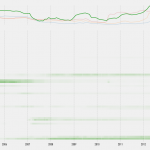
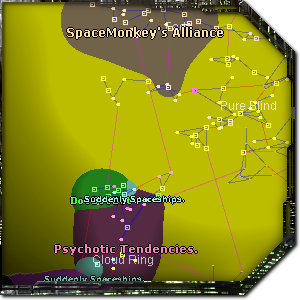
The chart of Net Exports by Region shows that Jita imports around 20 trillion worth of goods each month, but the next-highest importing regions are Tenerifis (16.8 trillion ISK), Delve (16.0 trillion ISK), Providence (11.72 trillion ISK), Pure Blind (10.56 trillion ISK), and Catch (8.82 trillion ISK). These are highly populated areas owned by nullsec alliances that are reliant on shipping in goods from empire. The high imports in these regions may indicate the creation of military stockpiles or the replacement of capital ships lost in recent wars.
Interestingly, some nullsec regions were reported as heavy exporters throughout February, with Period Basis exporting 8.67 trillion ISK worth of goods and Fade exporting 7.84 trillion ISK. As mining and production in those regions were both very low, this means the people living there must have moved a lot of their valuable assets out of the region. Both SpaceMonkey’s Alliance in Fade and RUCA Emperor in Period Basis lost members and territory during the month, so this isn’t altogether surprising.
The export figures for the regions may indicate that members of those alliances have no confidence in their ability to hold their territory and were evacuating assets. They could also be simply moving their staging systems for fleets somewhere else or may have taken considerable ship losses. It’ll take someone with more in-depth knowledge of current nullsec events and politics than I to figure out exactly what’s going on here, but it’s pretty exciting to have access to these kinds of broad data to speculate with. I’m looking forward to seeing what the EVE blogging community makes of this economic report and what new information might be included in next month’s installment.
 EVE Online expert Brendan ‘Nyphur’ Drain has been playing EVE for over a decade and writing the regular EVE Evolved column since 2008. The column covers everything from in-depth EVE guides and news breakdowns to game design discussions and opinion pieces. If there’s a topic you’d love to see covered, drop him a comment or send mail to brendan@massivelyop.com!


")


